3.5.5.1. Fish Habitat Modeling
Fish Habitat Model - Intrinsic Potential (IP)
Parameter Description: A relative ranking of fish habitat quality for anadromous fish using preference curves and a geometric mean approach, based on Burnett et al. (2007). The tools can use default parameter values for coho (Oncorhynchus kisutch) and steelhead (O. mykiss) (Burnett et al. 2007), Chinook salmon (O. tshawytscha) (Busch et al. 2011). In 2017, pink (O. gorbuscha) and chum (O. keta) salmon have been added to NetMap's IP modeling tool (Romey 2017). A provisional sockeye salmon model was developed for the Chugach National Forest in southwestern Alaska.
Figure 1. NetMap’s Create Habitat tool is used to build customized aquatic habitat indices, including habitat intrinsic potential (species specific), biological hotspots, and habitat sensitivity, etc. A user selects an existing model for anadromous or resident species (current there are 15) and the output field name will be listed in (2). A user can also build their own fish model using the habitat builder tool and name it (2).
Up to six parameters can be chose chosen (3). The range of values and equal divisions are automatically displayed (4), and the divisions can be adjusted (5). The user determines the variation in weighting assigned to each data division (5), e.g., 0 to 1. The preference curves can be viewed (6). The selected attribute can also be viewed in the map (7). Settings can be saved (8) for later access. Run the model (9).
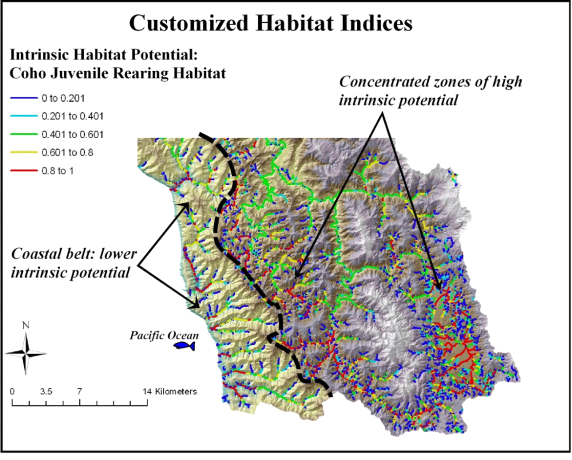
Figure 2. NetMap’s habitat creator tool allows users to examine and visualize the varying spatial distribution of different habitat types (by species) in a watershed. A user can analyze how different landscapes lead to different spatial distributions of habitats. The example shown is from northern California and it shows low habitat potential for coho salmon along the narrow and steep coastal belt of mountains and a much expanded habitat potential in the upper reaches of the Russian River.
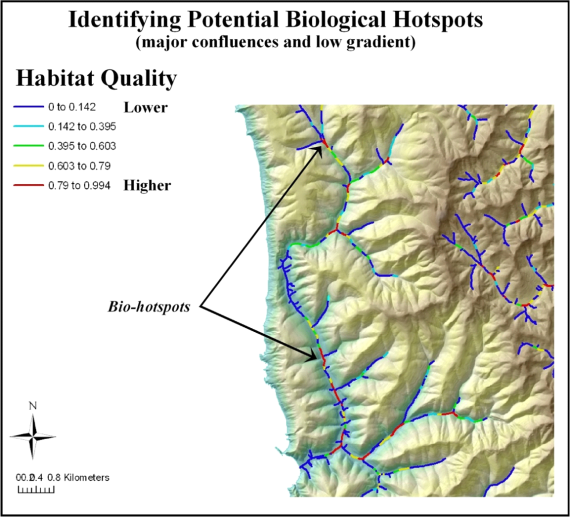
Figure 3. NetMap’s Create Habitat Indices tool is used to predict “biological hotspots”. In this example, hotspots are defined as the convergence of major confluences with low gradient channels with wide floodplains.
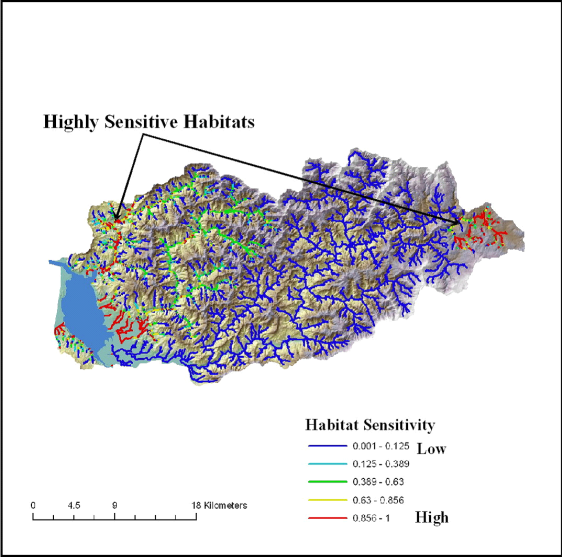
A parameter called “habitat sensitivity” can be developed using the same model. Habitat sensitivity can involve channel criteria such as channel gradient, drainage area, and confluence effects (Figure 4). A model based on these and other related channel attributes can indicate those channel segments that are sensitive to influxes of sediment from hillslope erosion, etc. A user can also add hillslope parameters that may relate to the potential for a channel to change its morphology, such as erosion potential (GEP), debris flow potential (at junctions in fish bearing streams), fire risk, burn severity or road density. A user may also create a channel sensitivity index and then use NetMap’s ‘Overlap Tool’ to seFieldh for juxtapositions between risky hillslope conditions and channel sensitivity.
Figure 4. The parameters of channel gradient, floodplain width/channel width, and local sedimentation potential are used to predict habitat sensitivity in the Wilson watershed in Western Oregon.
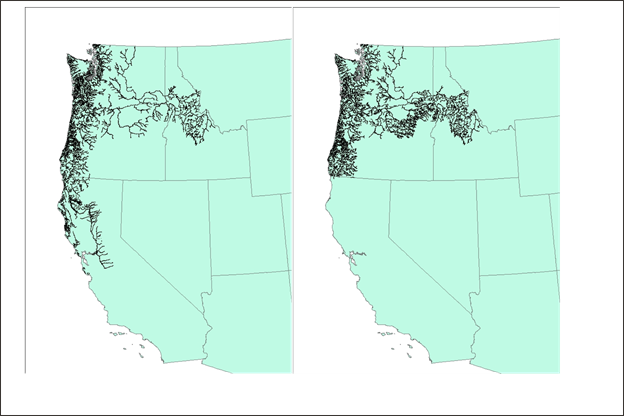
Although analysts can define their own fish distribution based on local knowledge or their own data, other more general information can be used such as that available from the "streamnet" mapping (for confirmed fish bearing streams). However, the distribution can also be extended beyond that to all streams and rivers that are potential habitats based on gradient and flow thresholds in the intrinsic potential model, including those systems where fish are extinct or extirpated. In this approach, all channels that might have been accessible, but are no longer, are included. For source data, see:
http://www.streamnet.org/mapping_apps.cfm