| < Previous page | Next page > |
Overlap Tool - Reaches18
OVERLAP TOOL - REACHES (Risk Analysis)
NetMap Module/Tool: Analysis Tools/Risk Analysis
NetMap is used to conduct different types of risk analyses that involve identifying the spatial juxtapositions between predicted hazards (erosion, flooding potential, wildfire risk etc.) and sensitive and valuable aquatic resources. This tool works at the reach scale; see also the tool that works at the subbasin scale.
Overlap Tool
Model Description:
One component of a risk analysis, in the broadest sense, is to identify where areas of likely impacts (such as erosion, landslides, road drainage diversion, lack of instream wood, increased thermal loading etc.) spatially overlap with areas of sensitive resources. For example, landslide potential and fish habitat quality are not distributed uniformly across watersheds. Some areas have higher potential for failure than others. Across a stream network, some reaches or valley segments have a higher potential for quality fish habitat. One objective of a risk analysis is to determine where the highest potential for human caused disturbance (such as erosion) overlaps with the best habitats.
NetMap contains a tool to identify overlaps between predicted high risk areas and predicted areas of high quality aquatic habitat. In regards to hillslope attributes, Drainage Wings are used to transfer the information on the hillside (such as erosion potential, e.g., GEP) to adjacent stream segments. In that way, hillslope attributes can be spatially overlain with particular channel attributes. The tool contains the capability to search across the full statistical distribution of values of interest, arrayed from the highest to lowest value. For example, the locations of the highest debris flow potential in fish bearing streams (top 10%, top 5%, top 1% etc.) are identified and their locations can be examined with respect to the highest quality fish habitat ((top 10%, top 5%, top 1% etc.).
Use of the tool is illustrated in Figures 1 through 4. Risk analysis, via identifying spatial overlaps of key watershed stressors and valuable resources, can also be conducted at the scale of subbasins (see Overlap Tool – Subbasins). These capabilities also exist in NetMap’s Browser Tools (TerrainWorks Viewer - available by subscription).
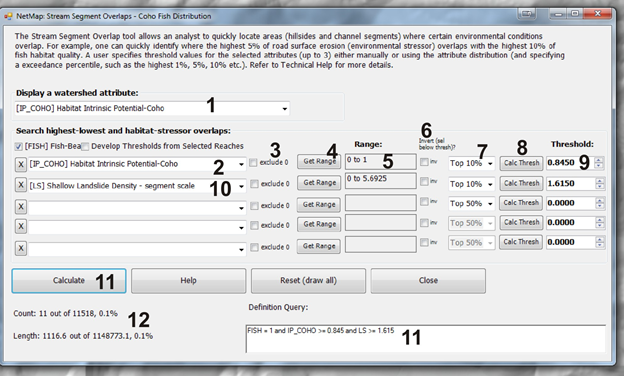
 Figure 1. NetMap’s Overlap Tool allows a user to quickly identify spatial juxtapositions of hillslope hazards (erosion, landslides, road drainage diversion, lack of instream wood, increased thermal loading etc.) with sensitive and valuable aquatic resources (fish habitat, water quality, roads, municipal water supplies etc.). (1) A user selects the NetMap attribute that will be displayed in the map (in the example above Habitat Intrinsic Potential - Coho). (2) Next one or more (up to 5) NetMap attributes is selected from the drop down lists (2 & 10). For example, shallow landslide potential is selected in the drop down list (10). (3) Zero values can be excluded from the search for overlaps. (4) The range of values can be displayed for the chosen parameter (5). (7) The portion of the frequency distribution of values can be searched for, for example, the top (highest) 10% of coho intrinsic potential values (the assigned threshold refers to values above it); (8) the threshold value must be calcuated, yielding a threshold value (9). If the frequency distribution needs to be inverted in the search, for example to search below a threshold, check the box at (6). Calculating the overlap (11) yields the search criteria (11), and the number of successful hits and the proportion of the network are indicated (12).
Some examples:
    Figure 2. Some examples of running NetMap's overlap tool. To see the full analysis in support of watershed restoration, see here for self guided PPT-PDF and here for the video.
 Figure 3. An illustration in the use of NetMap’s overlap tool shows how Road Density (calculated at the scale of individual channel segments, using Drainage Wings, is overlaid on the inherent erosion potential of hillsides (using Generic Erosion Potential), and which is further overlaid on fish habitat quality (Intrinsic Potential). A user selects threshold values for these three attributes (e.g., top 10%, top 5%, top 1% etc.) using the Overlap Tool (Figures 1-2), and reaches where these thresholds overlaps are identified (and in this example, color coded by fish habitat quality). Hence an analyst can quickly identify where in a large watershed, the greatest potential exists for road related impacts on habitats, are located. Field programs or restoration activities can be tailored to match these findings.
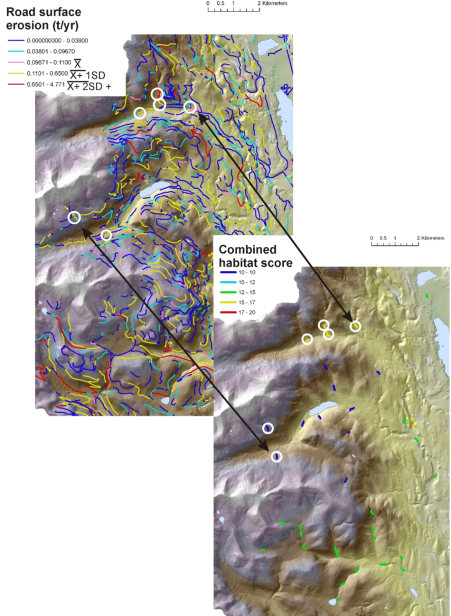
 Figure 4. An example result of using NetMap’s overlap tool where road surface erosion in streams is compared to a combined habitat score for Bull and Cutthroat trout. For additional information about this analysis in western Montana, see Road Surface Erosion.
 Figure 5. The map display shows the combined aquatic habitat score, where there are overlaps between the top 5% of road surface in streams. A user could apply this approach to prioritize where to conduct additional field surveys of road conditions and for developing road restoration strategies. For additional information about this analysis in western Montana, see Road Surface Erosion.
Visual Analysis (Overlap Detection)
Geospatial information (within a GIS) can be used, also in conjunction with other tools such as Google Earth, to identify relationships between areas of provisional high hazard in a watershed and other resource values.
 Figure 6. Using NetMap’s Google Earth Tool, users can export watershed attributes such as habitat intrinsic potential for steelhead (Top) and predicted hillslope erosion potential (Generic Erosion Potential). Spatial overlaps between areas of high risk and areas of sensitive habitats can be quickly identified. Example is from the Hoh River basin in western Washington.
 Figure 7. Following export of NetMap’s erosion attributes (in this example, Generic Erosion Potential), NetMap users can drill down to the scale of individual hillslopes to identify landslide prone areas that may be susceptible to timber harvest and road construction. Example from a particularly steep and dissected area of the Oregon Coast Range.
|