Description: The ability of roads to generate runoff, surface erosion and sediment delivery to streams is predicted by NetMap's READI model. At the scale of individual road segments, READI can be used as a dimensionless index on inherent erosion potential to prioritize road segments for field validation, maintenance and remediation, but calibration to field measured erosion rates can increase accuracy and be used to predict sediment yields (e.g., kg/storm or t/storm or dimensionless units/storm; the time unit is "storm" since READI is run on a per storm basis, typically a "design storm". READI can also be calibrated using field measured sediment transport distances or sediment plume lengths. READI can be run over mutlipe storms, manually, to calculate a per annum sediment yield.
Additionally, READI includes an optimization component that is used to predict where additional road drains can be strategically placed to further disconnect road segments from streams and where road maintenance and upgrades can reduce sediment delivery. When using READI to predict location of new drains, one MUST consider the potential for the new drain runoff to trigger gullies, landslides and debris flows. See below for a description of READI in the context of slope stability.
READI can be used in post fire environments, using decreased soil infiltration, to identify roads that can have increased road-stream connectivity post fire, thus informing post fire mitigation. READI can also be used to help understand how climate change can exacerbate road impacts in watersheds by using an altered climate.
Begin Analysis:
READI_ID = road line layer, will have added drain points; a road layer broken up into hydrologically discreet segments based on road-stream intersections and high and low points along the topography (referred to as natural drains, and see here); (ID refers to NetMap's vritual watershed dataset name)
READIout_DrainPoints_ID = drain point shapefile, can have added drain points (a road layer broken up into hydrologically discreet segments based on road-stream intersections and high and low points along the topography [referred to as natural drains, and see here]); this layer is not loaded using the tool, but exists in the NetMap dataset folder
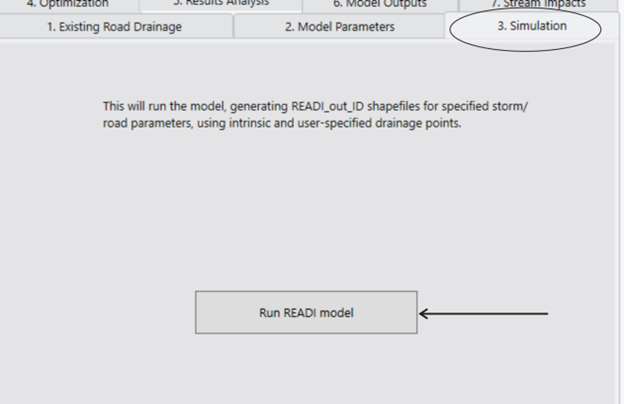
Run READI Simulation:
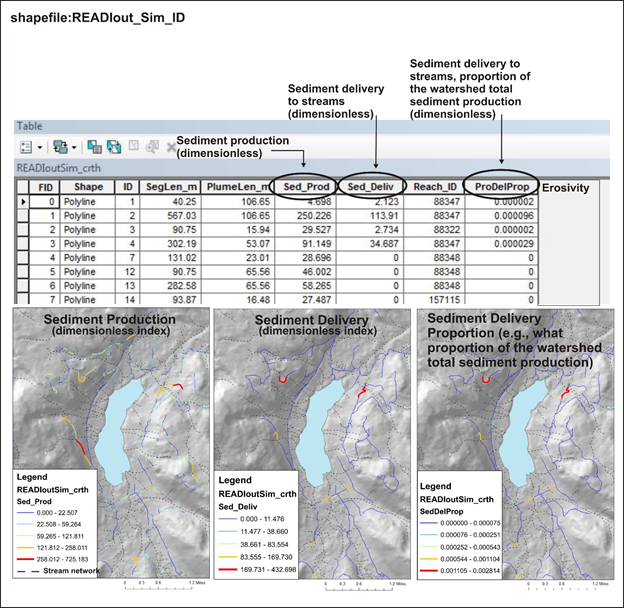
READIoutSim_ID = road layer (READI_ID) with output attributes including sediment production and sediment delivery to streams (see output ArcMap attribute tables below)
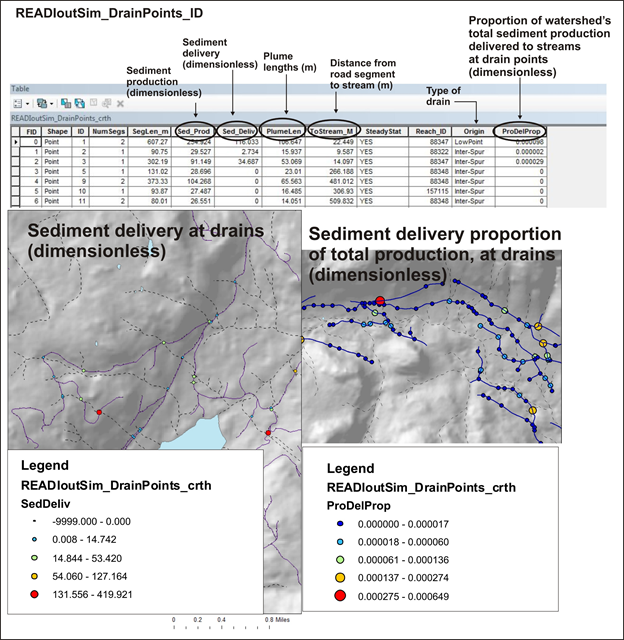
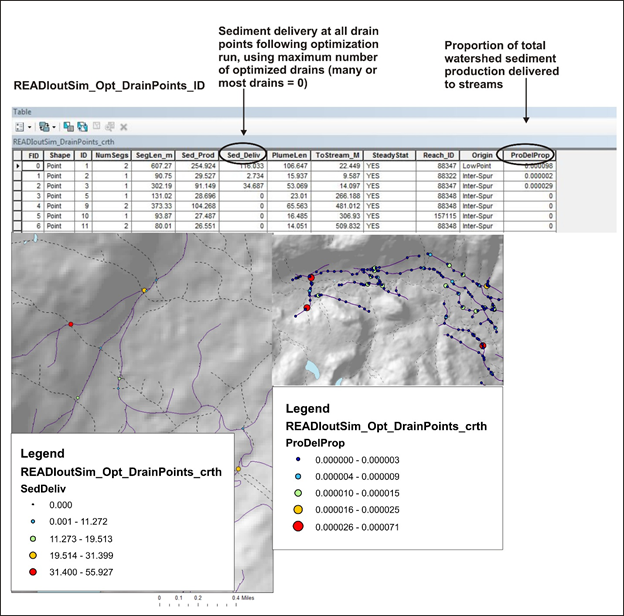
READIoutSim_DrainPoints_ID = output drain points with attributes including sediment production and sediment delivery to streams (see output ArcMap attribute tables below)
Generate Optimized Drain Locations and Optimized Locations for Road Surface Remediation:
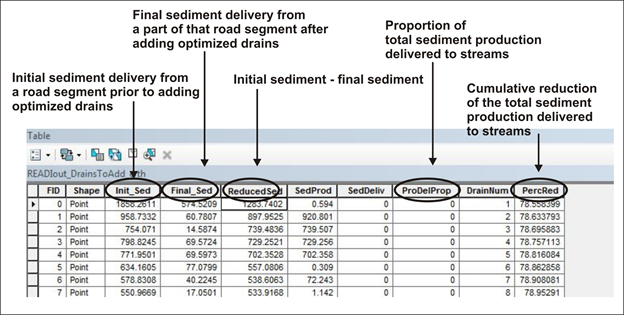
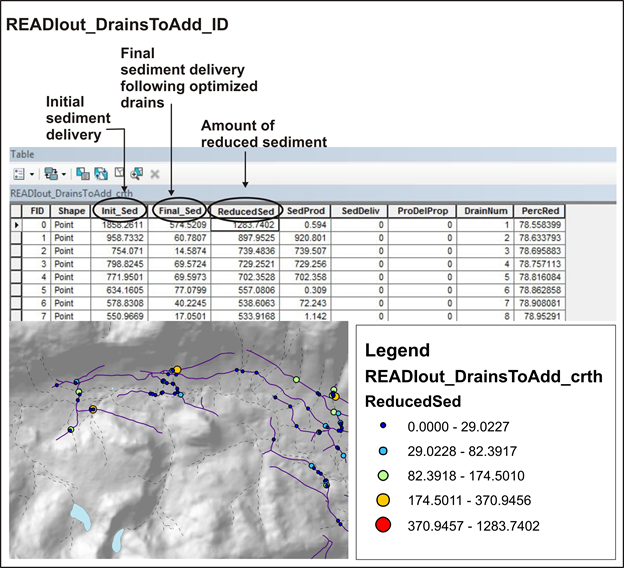
READIout_DrainsToAdd_ID = Select those you want to use to rerun the simulation, they are sorted in the attribute table by effectiveness (at reducing road sediment delivery);
Run READI simulation with Optimized Drain Points:
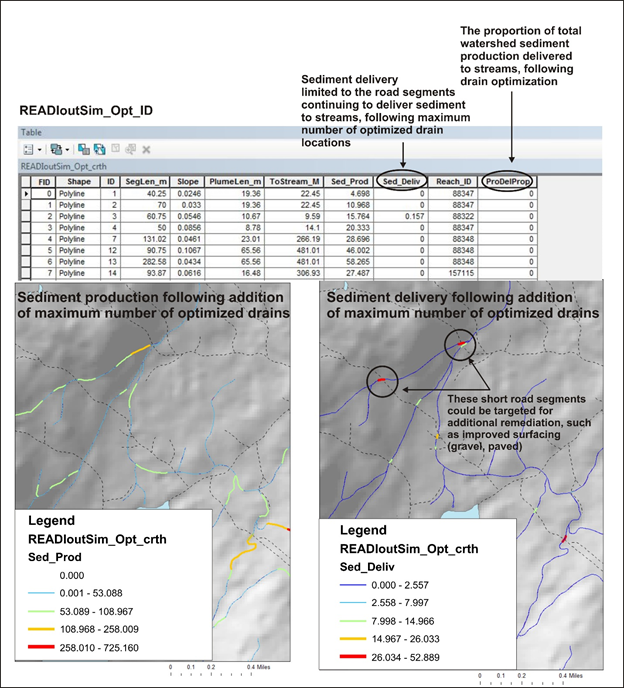
READIoutSim_OPT_ID = model output with attributes including sediment production and sediment delivery to streams (see output ArcMap attribute tables below)
READIoutim_OPT_DrainPoints_ID = model output with attributes including sediment production and sediment delivery to streams (see output ArcMap attribute tables below)
Units: Variable: READI can be applied as a dimensionless index (by setting E = 1) or given calibration in units of kg/yr or tons/yr etc.
Model Description:
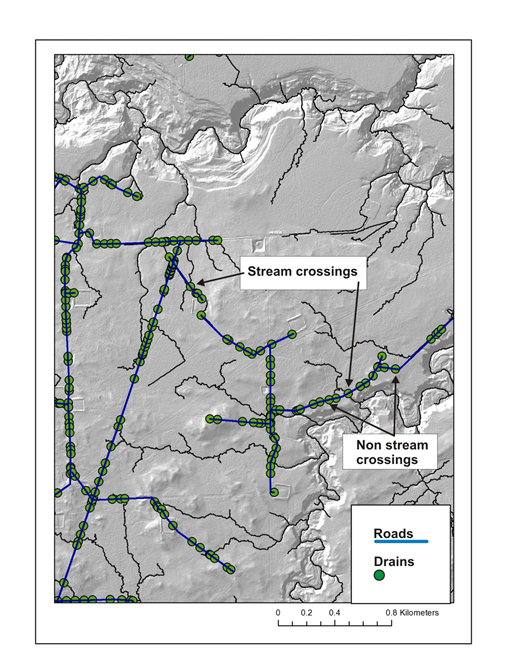
The road network (lines) is first broken at pixel cell boundaries. The individual, approximately pixel scale road cells, are then re-aggregated into hydrologically connected segments (tens to a hundreds of meters in length) that represent water flow paths from high (topographic) points to low (pour) points or to defined streams (see here). These hydrological road segments can be viewed in terms of their drainage diversion potential. For example, in the absence of secondary road drainage structures, the drainage diversion road segments should indicate the water diversion potential of any road segment, particularly under conditions such as during large storms or following wildfires.
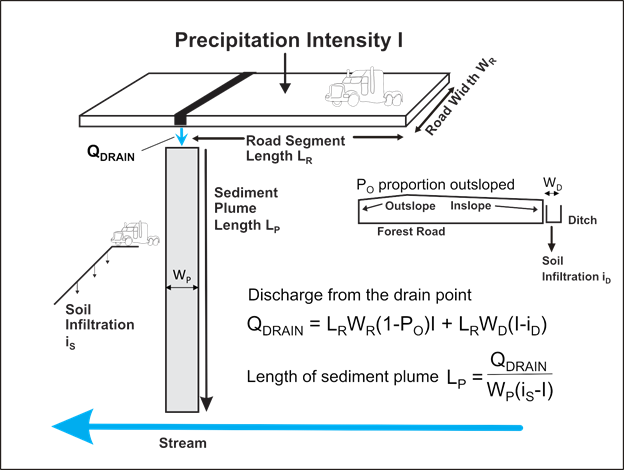
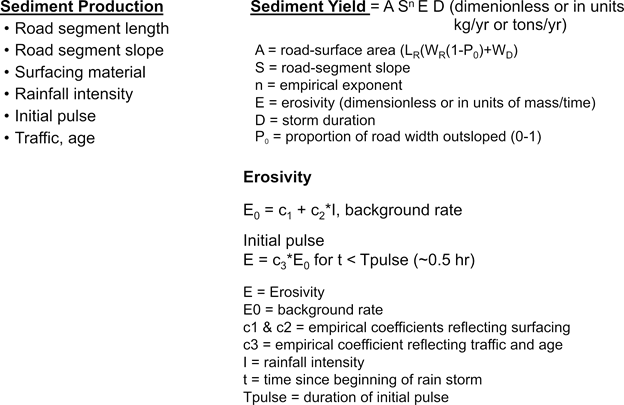
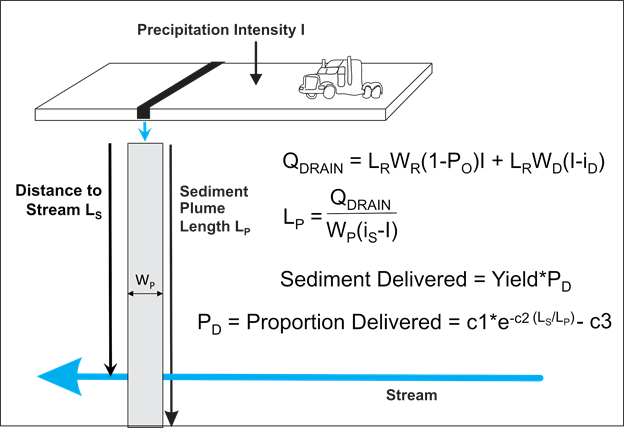
Figure 1. READI predicts road water runoff by multiplying road segment length by road width and rainfall intensity (m/yr) in units of m3/hr; the runoff can be adjusted by the proportion of road width outsloped. A water/sediment plume is
predicted that has a default rectangular shape (other shapes could be used) with an assigned plume width. Soil infiltration occurs along the plume; the model requires that rainfall intensity < soil infiltration capacity, otherwise there is
Hortonian overland flow and unlimited sediment transport distances.
Delivery of sediment and water to a stream is dependent on calculated plume length. Water delivery is based on integration of a hydrograph at the base of the plume. Sediment delivery is calculated by integrating sediment production from the road surface multiplied by a delivered proportion that is a function of the ratio of distance-to-stream and plume length; PD = c1*EXP(-c2*(LS/LP)) + c3 (LS is distance to stream). It is assumed that if LS/LP < 1.0, PD = 0, and that PD cannot exceed 1.0. Supporting literature: Croke et al., 2005; Ketcheson and Megahan, 1996. The predicted distribution of plume lengths can be calibrated using field measured plume lengths.
Erosivity is calculated as a base rate E0, and a “pulse” rate that may occur at the beginning of a storm, during which fine sediment accumulated since the last storm is flushed off the road surface. The base rate is calculated as E0 = c1 + c2*I, where I is rainfall intensity. The initial pulse is represented as a multiplicative increase of E0: Epulse = c3*E0, applied for a time Tpulse at the beginning of the storm. This model provides a simple representation of the behavior observed in numerous monitoring experiments, both for natural and artificial rainfall (e.g., van Meerveld et al., 2014). To set a constant background rate unaffected by rainfall intensity, set c2 to zero. To ignore the initial pulse, set c3 to zero.
Erosivity coefficients are also indicated for each road segment as data fields in the originating road shape file.
Figure 2. The proportion of sediment delivered to the stream is governed by a non linear relationship between predicted plume length and distance to stream.
READI Model Interface
Model Interface
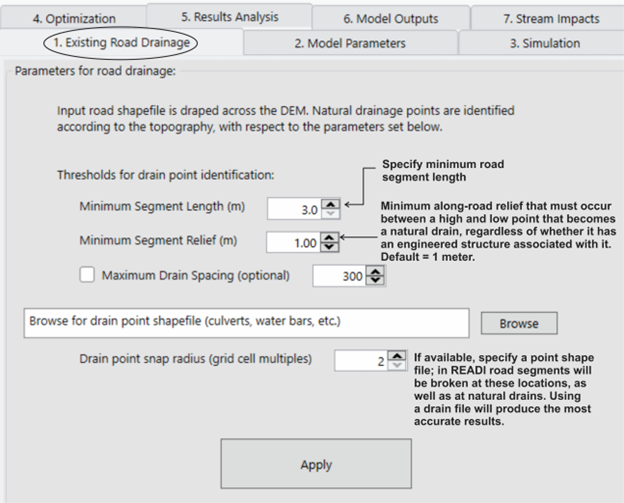
Tab 1:
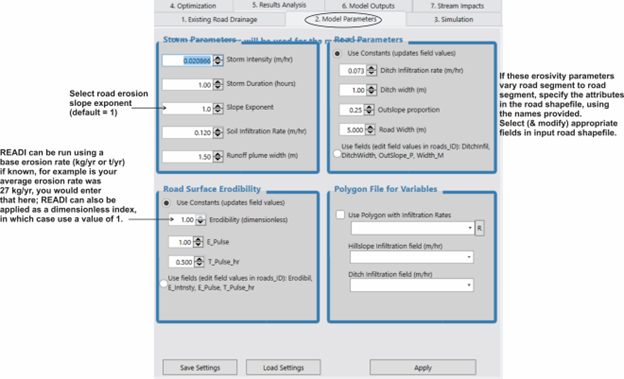
Tab 2:
Tab 3:
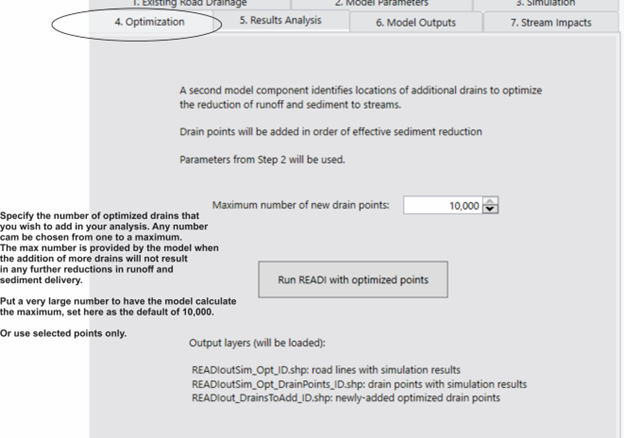
Tab 4:
Tab 5: (note some of the model interfaces below will be somewhat different in appearance that what is available in the ArcPro version of NetMap tools)
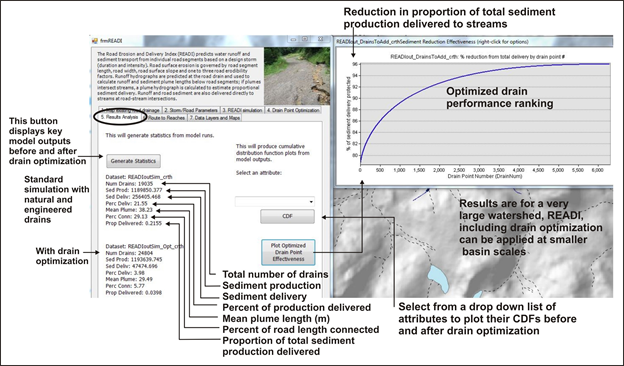
TAB 5
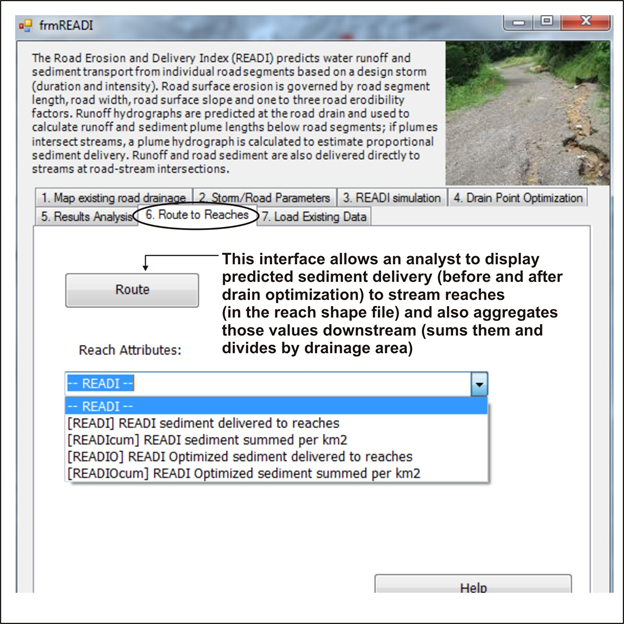
TAB 6
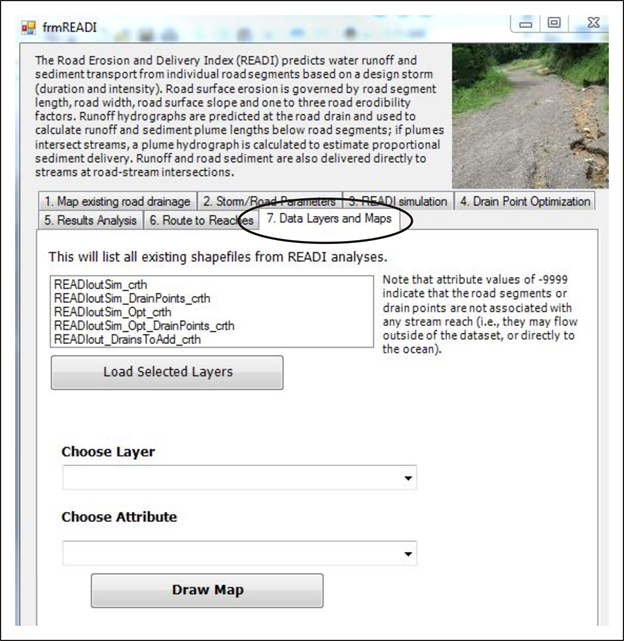
TAB 7
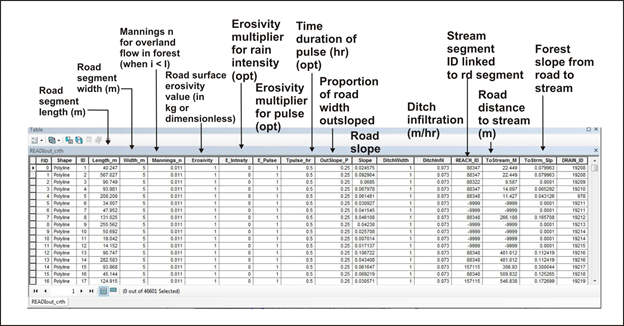
Model Inputs Shapefile (READIout_ID); for reference purposes
Key model output (for additional output parameters, refer to Appendix below).
Road Segments
Road Drain Points
When you run the READI Optimization Module (for strategically locating new drains to maximize sediment reduction effectiveness, here
are you key data (additional attributes in the shapefiles are shown in the Appendix, and end of page).
Road Segments
Road Drain Points
Optimized Drains to Add (Points)
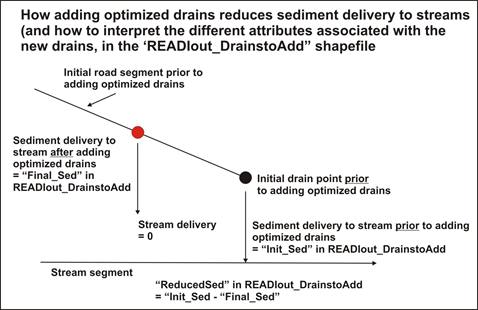
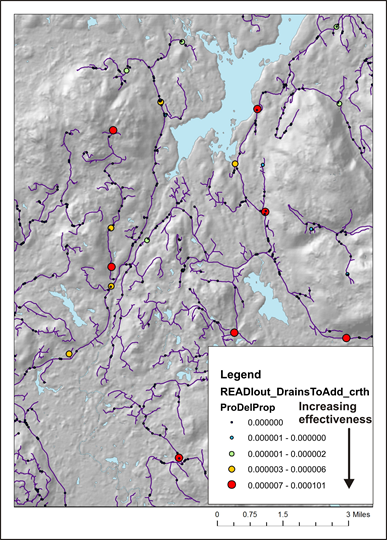
An analyst can use the attributes in the "drains to add" shapefile to prioritize placements of new drains to eliminate or reduce sediment delivery. See figures below.
Another way is to use 'ProDelProp' and prioritize by the relative reduction in the proportion of total sediment production delivered to streams.
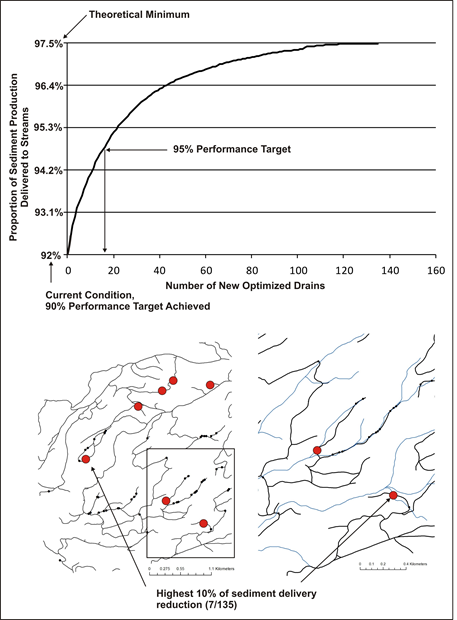
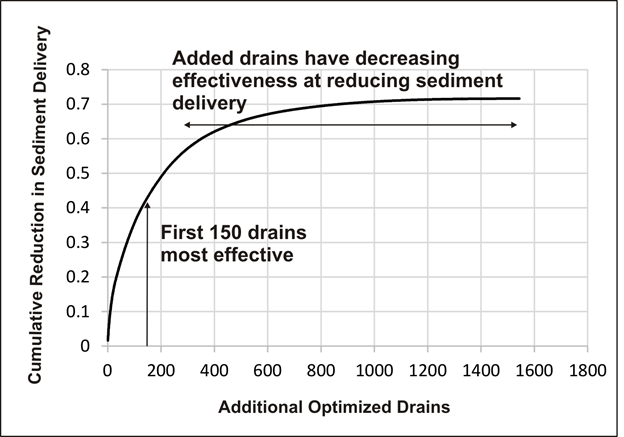
New optimized drains are ranked according to effectiveness, the first ones in the queue are the most effective at eliminating or reducing sediment delivery, their effectiveness drops off with increasing number of drains, see example below.
READI and Slope Stability
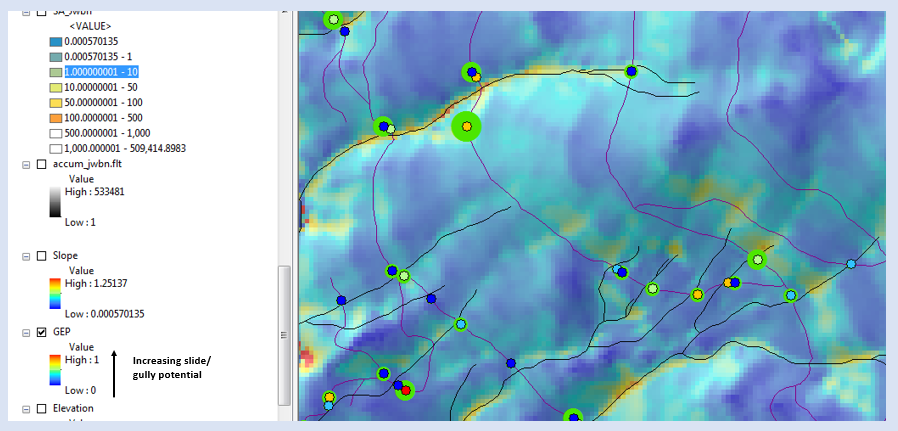
Using NetMap, placement of new drains must consider the potential for the new drain to trigger new gullies, landslides and debris flows. Two approaches are recommended. (1) The scientific literature identifies the use of the slope-area product, with area being the road surface segment area and the slope the hillslope gradient measured below the drain point (Montgomery 1994; Croke and Mockler 2001; Rakken et al. 2008). Thus, READI includes an attribute "slope area"; the higher the values the greater the potential that new drain runoff can trigger a gully or landslide. It is recommended that the attribute of reduced sediment of new drains by overlaid on top of the slope area attribute using a scheme shown in the figure below.
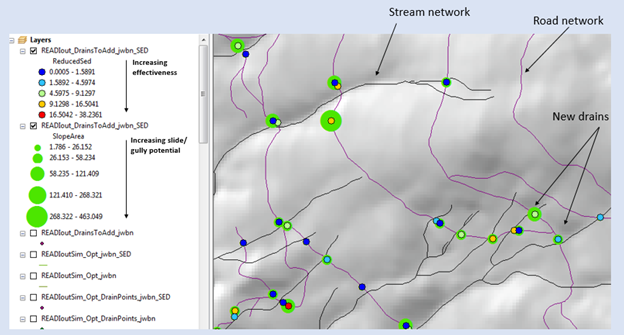
READI reduced sediment for new optimized drains overlaid onto predicted slope area product indicating the relative likelihood of new drain runoff to trigger gullies or landslides.
When considering placement of new drains, NetMap Generic Erosion Potential attribute should also be used, in conjunction with READI new drain attributes and the slope area product. See figure below.
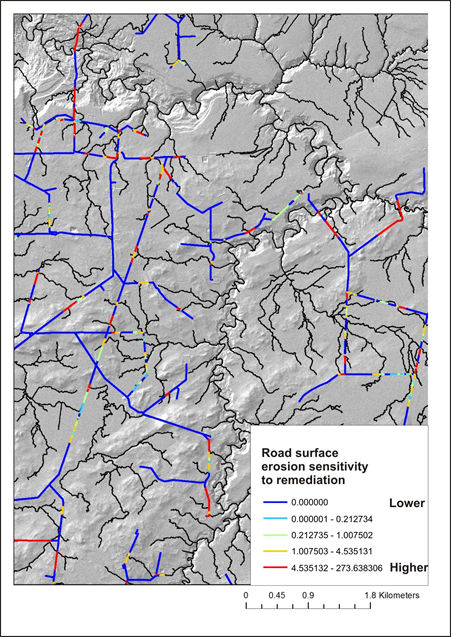
Prioritizing Upgrades to Forest Road Surfacing
One can also prioritize where new road surfacing or other road surface erosion reduction strategies could be applied, and priortize them. For this exercise, it is best to create maps of predicted sediment delivery before or after calculating effects of adding new, optimized drains, and use those maps to identify those road segments with the highest predicted delivery. Then consider, based on the existing surfacing, whether upgrading surfacing, say from native to gravel, will reduce predicted sediment delivery. A map of prioritzation could be developed.
Model Application Example:
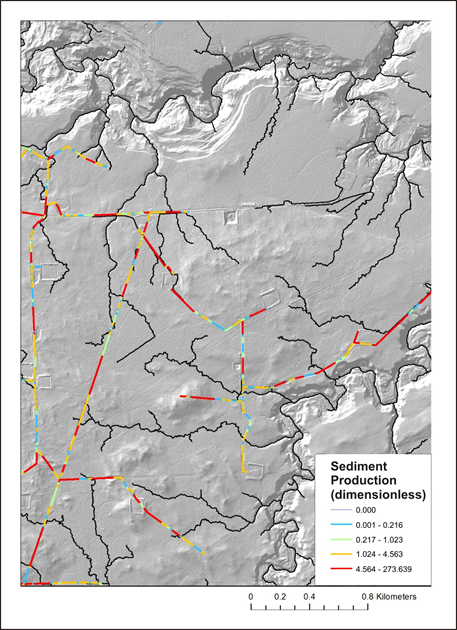
Figure. Starting drains either using the model, or loaded Figure. Predicted sediment production.
GPS drain points, referred to as natural or intrinsic drains.
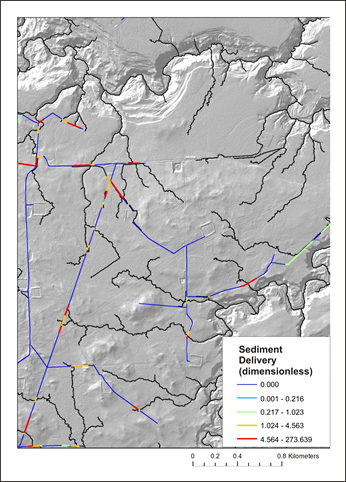
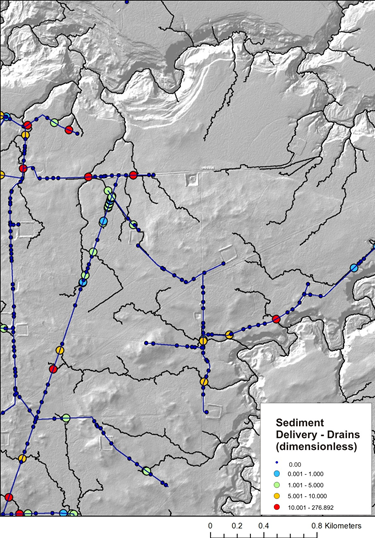
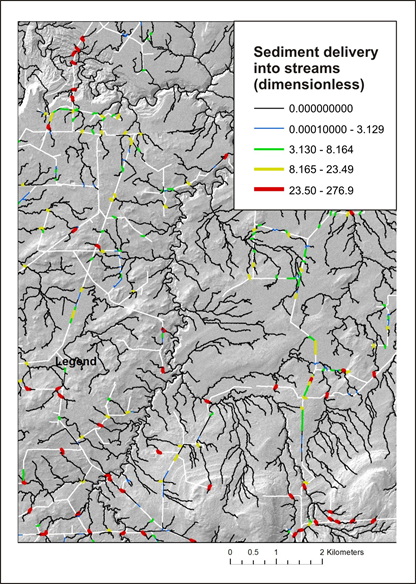
Figure. Predicted sediment delivery to streams (yo set to 1). Figure. Sediment delivery predicted at individual drain points.
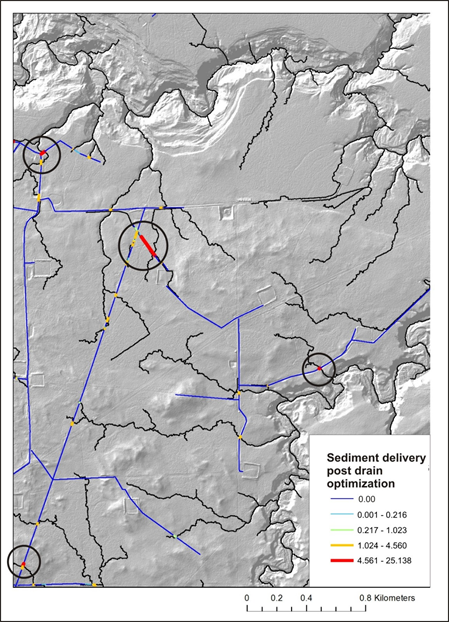
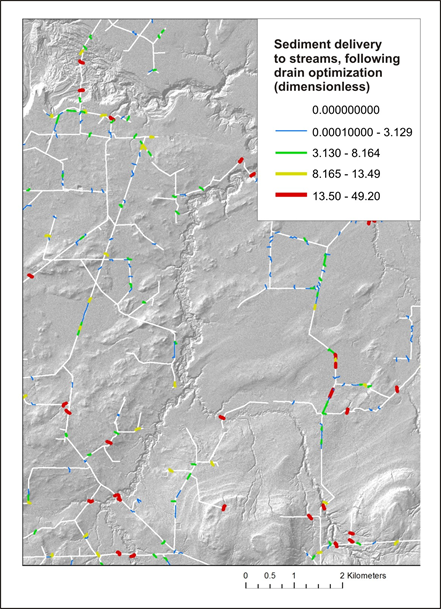
Figure. Optimized new road drain locations (added to natural Figure. Predicted sediment delivery following new drain optimization.
drains (see Figure above).
Figure. The cumulative effectiveness of adding new optimized Figure. Relative effectiveness of road surface improvements in reducing erosion.
drain points.
Figure. Predicted sediment delivery using non optimized drains Figure. Predicted sediment delivery using added optimized drains reported to reaches.
displayed in stream reaches (in NetMap's reach shapefile).
Table. Example summary of READI outputs in the Simonette River watershed.
|
Parameter
|
Current Condition
|
After Adding Optimized Drains
|
Percent Change
|
|
Sediment Production
(dimensionless)
|
43,824
|
43,824
|
0%
|
|
Sediment Delivery
(dimensionless)
|
15,358
|
4,277
|
-72%
|
|
Fraction of Production Delivered to Streams
|
35%
|
9.8%
|
-72%
|
|
Percent Road Length
Hydrologically Connected
|
32%
|
8%
|
-75%
|
|
Average Sediment Transport Length (plume length)
|
14.5 m
|
7.9 m
|
-45%
|