NetMap's Watershed Assessment
Watershed Attribute: The susceptibility of channels to debris flow movement, scour and deposition, in terms of probability; an empirical model (Miller and Burnett 2008). Two attributes are provided: (1) proportion of debris flow risk (watershed scale) and (2) combined proportions of landslide and debris flow risk.
Refer to Debris Flow parameter for additional background information.
The model is most applicable to the Oregon Coast Range; however, it utilizes topographic information that has been found to be relevant to debris flow movement in other terrains (Swanson and Lienkaemper 1978, Hungr et al. 1984, Benda and Cundy 1990, Fannin and Rollerson 1993, Fannin and Wise 2001). In all landscapes, the debris flow predictions should be considered as a screening tool. Field measurements and on the ground surveys are needed to make more accurate predictions.
Data Types: Grid (raster)
Field Name: TravProp_basinID.flt; SrTc_basinID
Units: Proportion of total debris flow risk in a watershed, at 20% percentile increments from highest (20%) to lowest (20%). Proportion of combined landslide and debris flow risk.
NetMap Level 1 Module/Tool: Mass Wasting/Slope Stability
Model Description: Proportion of Debris Flow Risk (watershed scale)
Field Name: TravProp_fhca.flt
This attributes estimates the proportion of debris flow risk, in terms of traversed stream segments, based on the cumulative distribution of values, starting at the maximum risk of traversal, e.g., the top 20%, the next highest 20% and so on (Figure 1). This parameter is sensitive to a defined channel gradient threshold that defines "delivery" of sediment and wood to streams (in the NetMap Watershed Assessment Level 1, the default is delivery to ALL channels). Refer to the Delivery Tool for additional information available in the Level 2 Tools.
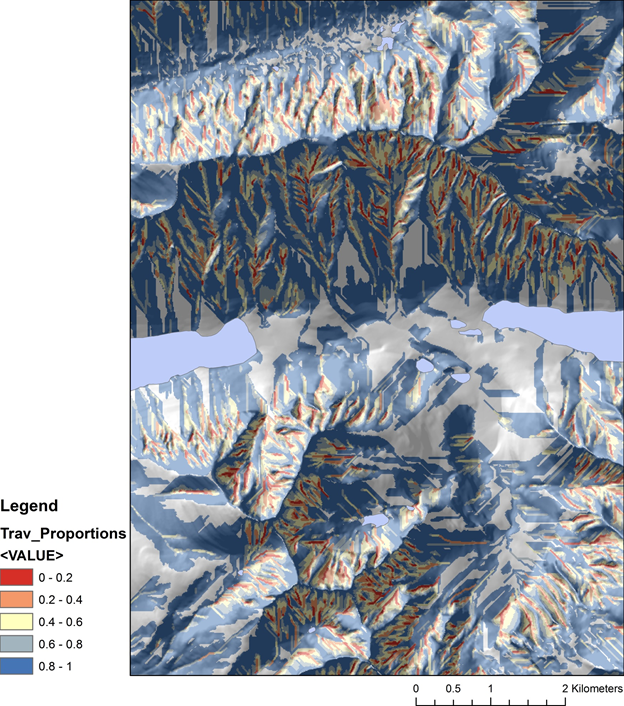
Figure 1. An analyst can select the "traversal proportion grid" to examine the proportion of debris flow runout risk in increments of 20% of the full distribution, such as the highest 20%, the next highest 20% and so on. A user can specify a different channel gradient threshold to examine debris flow runout risk, e.g., runout to channels less than 8% (anadromous fish habitat), less than 20% (resident and anadromous fish habitat) etc. That feature is available in the NetMap Level 2 Analysis Tools.
Model Description: Proportion of Combined Shallow Landslide and Debris Flow Risk (watershed scale)
Field Name: SrTc_basinID
Debris flow risk can also be combined with the risk of shallow failures, since shallow failures trigger debris flows in NetMap's models (Miller and Burnett 2007, 2008, Benda and Dunne 1997a). In this model, the proportion of risk from shallow landslides is combined with the proportion of debris flow risk. The resulting parameter predicts a combined risk factor for both (Figure 2). This parameter is sensitive to a user defined channel gradient threshold that defines "delivery" of sediment and wood to streams. Refer to the Delivery Tool for additional information (available only in NetMap Level 2 Tools). The default setting supplied with NetMap datasets is delivery to streams less than or equal to 200% (e.g., all streams).
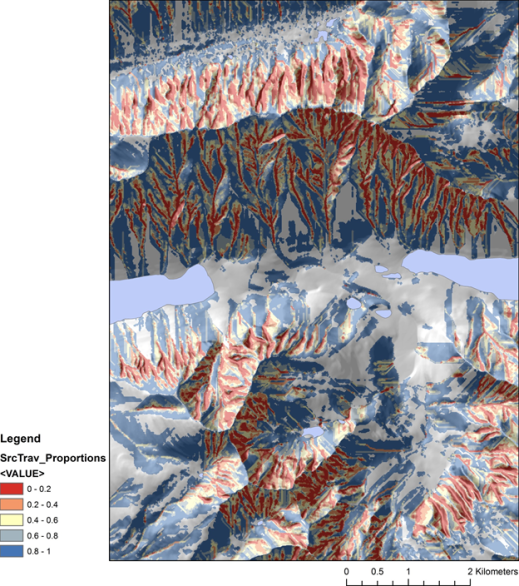
Figure 2. The predicted combined total shallow landslide and debris flow risk in increments of 20th percentiles (red = highest 20%, orange = next 20% and so on). NetMap's combined shallow landslide-debris flow risk index predicts areas in the landscape with different proportions of risk, starting with the most unstable and most likely to have debris flows (in increments of 20%, although that legend breakdown can be adjusted in ArcMap's symbology editor).
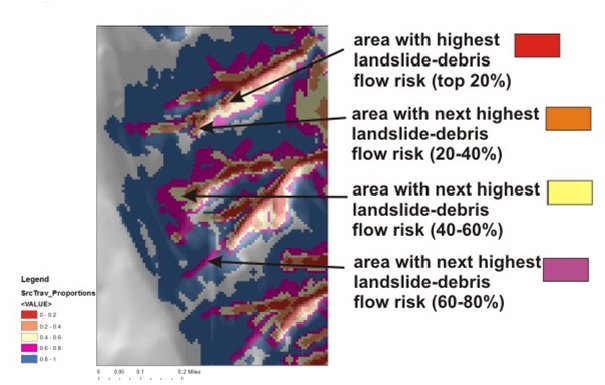
Figure 3. In the example above, the red colored areas have the highest 20% of risk combined in both shallow landslide area (unchanneled hillsides) and debris flows in headwater streams. The orange areas contain the next highest 20% or risk. The red and orange areas combined contain 40% of the risk. To identify areas that contain 80% of the predicted combined landslide and debris flow risk, red, orange, yellow and purple areas would added together. This type of prediction is also useful when considering managing landslide risk or when considering upslope source of large wood to streams in some landscapes such coastal humid areas.
