NetMap's Watershed Assessment
Watershed Attribute: Post Fire Erosion (surface); Miller, M.E., L.H. MacDonald, P.R. Robichaud and W.J. Elliot. 2011. Predicting post fire hillslope erosion in forest lands of the western United States. International Journal of Wildland Fire 20, 982-999).
Data Types: Raster; lines (reach)
Field Name:
Raster: WEPPMEM
Reach, segment (line): WEPP_MEM, Post Fire Erosion, Segment Scale (reach)
Reach, averaged downstream (line): WEPP_MEMC, Post Fire Erosion - averaged downstream (reach)
Units: WEPP post fire erosion in T/yr
Note the predicted post fire erosion is multipled by predicted fire probability (attribute #16) to produce an index of erosion that is scaled by the frequency of fire occurrence. Hence, the post fire erosion index provides information on the relative magnitude of erosion linked to fires and its variation across landscapes.
NetMap Level 1 Module/Tool: Vegetation/Fire/Climate - Fire Cascade
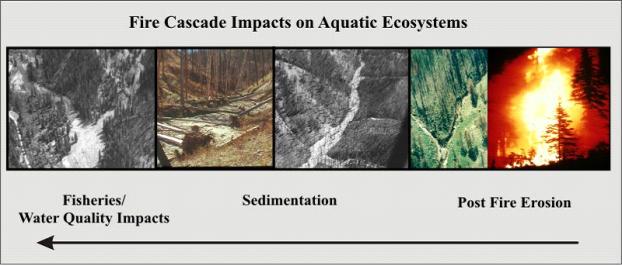
Model Description: Post fire erosion prediction (surface erosion using the WEPP model) is also available in the tool is based on results from Miller et al. (2011). See examples below. High severity wildfire can be a significant watershed stressor leading to a cascading sequence of impacts on aquatic ecosystems, including concentrated erosion (Figure 1).
Figure 1. A “fire cascade” is the cascading sequence of impacts that begins with high severity fire, accelerated erosion, increased channel sedimentation and large impacts on fisheries and water quality. Wildfires can represent a significant environmental stressor. High fire severity (large flame length) can lead to extensive areas of mineral soil, accelerated erosion (surface, gully, landsliding), increases in channel sedimentation and large impacts on water quality and fish habitats.
Extent of Post Fire Surface Erosion Data
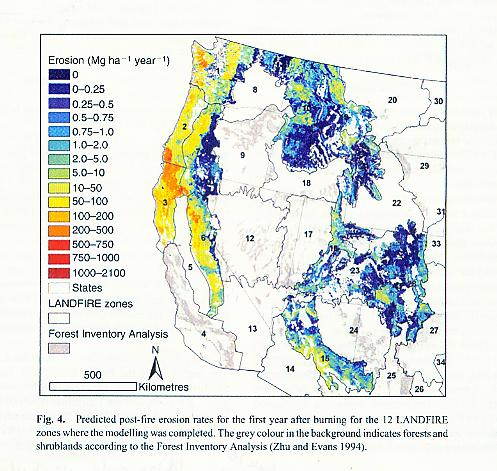
The WWETAC fire prediction data generally covers the entire forested western US. The post fire surface erosion data of Miller et al. (2011) contain gaps in coverage. See Map below from Miller et al. 2011.
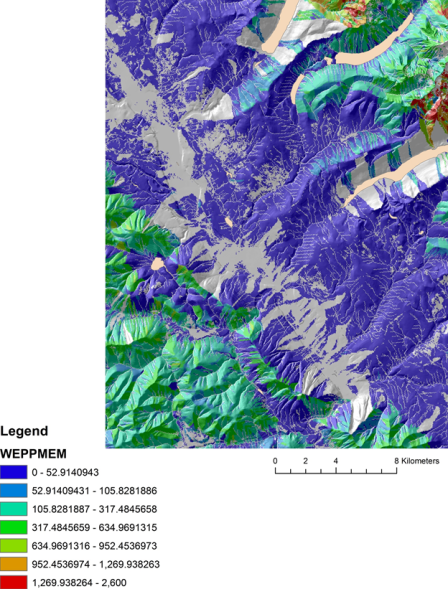
Figure 2. The predicted post fire erosion (average), as raster. See Figures 3 and 4 for a fish eye view of post fire erosion.
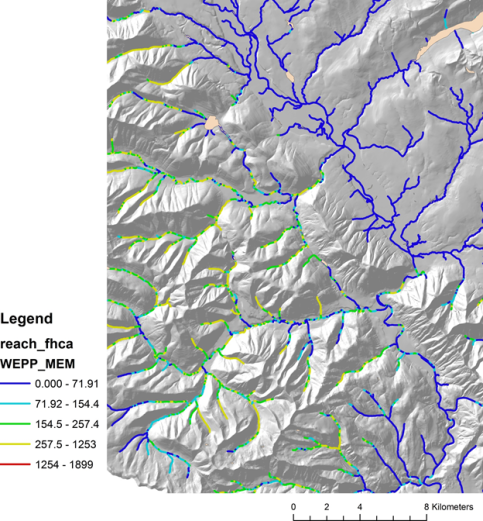
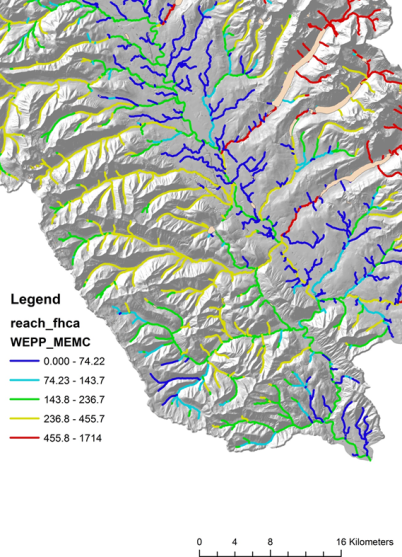
Figure 3. The predicted post fire erosion represented in channel reaches. The values aggregated and averaged downstream are shown in Figure 4.
Figure 4. The predicted post fire erosion averaged downsstream.