NetMap's Watershed Assessment
Watershed Attribute: Subbasin Classification (any watershed attribute) using any part of the cumulative distribution (mean, median, and any percentile or percentile range).
Data Types: Polygons
Field Name:
Basin_
Units: Variable, depends on watershed attribute.
NetMap Level 1 Module/Tool: Analysis Tools/Sub-basin Classification
Model Description: NetMap’s Sort and Rank tool is used to classify subbasins (typically US hydrologic unit code 6th field, 12 digit) in a NetMap digital landscape using available reach, grid or road data. NetMap calculates the cumulative distribution of any selected parameter within a population of subbasins (all subbasins within a watershed or only a subset of them). Any aspect of the distribution can be chosen to classify the subbasins (e.g., mean, median, and any percentile or percentile range, Figure 1). Thus, the Sort and Rank tool is used for conducting comparative analysis of one basin to another.
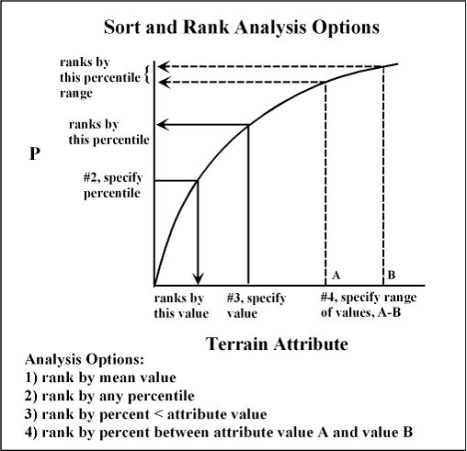
Figure 1. Netmap’s Sort and Rank tool creates cumulative distributions for each pre-defined polygon (such as HUC 6th or 7th field basins). The user must select what aspect of the distribution to search for (i.e., #6 in Figure 1). Options include: 1) means, 2) any percentile of the distribution, 3) by percent less than a given attribute value, and 4) by a percentage that lies between given attribute values.
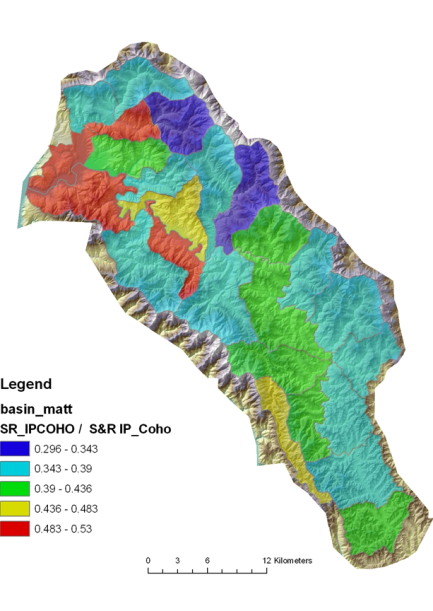
Figure 2. An example of subbasin watershed classification using intrinsic potential for coho salmon.
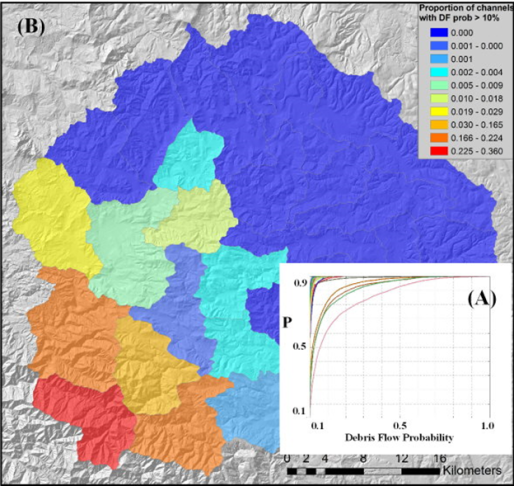
Figure 3. An example of subbasin watershed classification using debris flow potential in the Oregon Coast Range.
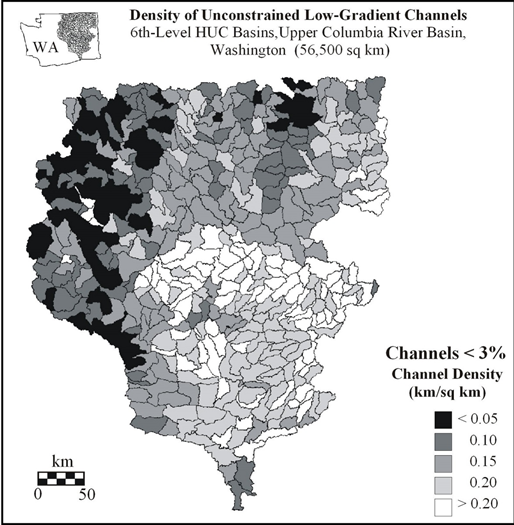
Figure 4. Watershed classification in the Upper Columbia River basin.